Short on time? Good demand forecasting starts with clean history, a simple baseline and a clear measure of error. Add seasonality, promotions, prices and external signals where they help, compare methods on held-back data and plan stock around a range of outcomes instead of one number. Review accuracy every cycle and improve the weakest products first.
Order too much and cash sits in unsold stock. Order too little and customers go elsewhere. Almost every business that sells goods, schedules staff or books capacity makes forecasts, often in a spreadsheet and often by instinct. Predictive analytics brings statistics and machine learning to the task, so forecasts reflect patterns in the data and can be measured.
This guide covers the practical steps of building a demand forecast, from data preparation to method selection and use in planning. It suits a small retailer working with a year of sales and a manufacturer with thousands of products across regions.
Key takeaways
- Start with a baseline, such as last year’s sales or a moving average. Any model must beat it.
- Data quality drives results: clean history, correct dates, stock-outs and promotions flagged.
- Choose methods that fit the data: classical time series for stable patterns, machine learning when many drivers matter.
- Measure accuracy on held-back periods and track bias as well as error.
- Forecasts are inputs to decisions. Plan with ranges and scenarios.
Define the forecasting problem
Be specific:
- What is forecast: units, revenue, calls, bookings, shipments?
- At what level: product, category, store, region or total?
- Over what horizon: next week for replenishment, next quarter for production or next year for budgets?
- How often will it be refreshed?
- Who uses it, and what decision depends on it?
Different horizons and levels need different approaches. A weekly forecast per product and store is a different task from an annual forecast per region.
Prepare the data
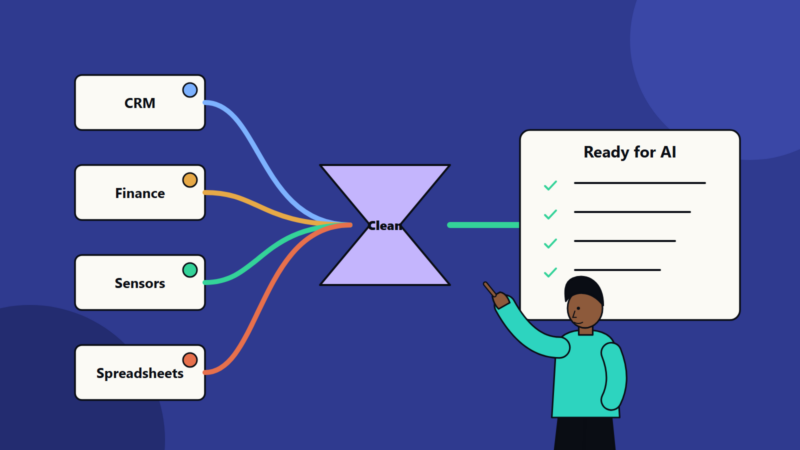
Collect history of sales or demand with dates, products, locations and channels. Then:
- Fix gaps and errors: missing days, duplicates, returns, negative values.
- Separate demand from sales. When a product was out of stock, sales understate demand. Flag stock-out periods or estimate lost sales.
- Mark events: promotions, price changes, holidays, launches, closures and supply problems.
- Add drivers: price, marketing activity, weather, local events, economic indicators and competitor actions, where they matter and can be known in advance.
- Handle new and discontinued products with rules or by using similar products as a guide.
- Keep consistent calendars, since week and month boundaries can distort comparisons.
Document each step, so the process can be repeated.
Understand the patterns
Plot the data. Look for:
- Trend: long-term rise or fall.
- Seasonality: repeating patterns by week, month or year.
- Cycles: longer, less regular swings.
- Noise and outliers: one-off spikes and dips.
- Intermittent demand: many zero periods with occasional sales, common for spare parts and slow movers, which needs special methods.
Time series textbooks such as Forecasting: Principles and Practice, a free online book by Rob Hyndman and George Athanasopoulos, cover graphics, decomposition and a wide range of methods for practitioners without formal training.
Choose methods
Start simple
- Naive and seasonal naive: use the last value, or the value from the same period last year.
- Moving averages.
- Exponential smoothing, which weights recent data more and can include trend and seasonality.
These often perform well and are easy to explain.
Statistical models
- ARIMA and related models for series with structure in their history.
- Regression models that include drivers such as price and promotion.
- Hierarchical methods that keep forecasts consistent across levels, for example products adding up to categories.
Machine learning
- Gradient boosting and random forests handle many drivers and many series at once.
- Neural networks and deep learning can help with large, complex data sets.
They shine when you have many related series, rich drivers and enough history. They need more care to avoid fitting noise, and they are harder to explain. Compare against simple methods before adopting them.
Judgement
Sales teams and category managers know things data does not, such as a customer’s plans. Capture their input in a structured way, and track whether adjustments improve accuracy, since over-optimism is common.
Validate properly
- Hold out recent periods. Train on earlier data and test on later data, mimicking real use. Do not shuffle time series randomly.
- Use rolling origin tests with several cut-off dates for a stable picture.
- Compare to the baseline in every test.
- Choose measures that suit the business:
- Mean absolute error or weighted absolute percentage error for overall accuracy.
- Bias, to see whether you over- or under-forecast consistently.
- Measures that cope with zeros for intermittent demand.
- Service level or cost-based measures that reflect real impact.
Report by segment, since averages can hide failures on key products.
Turn forecasts into decisions
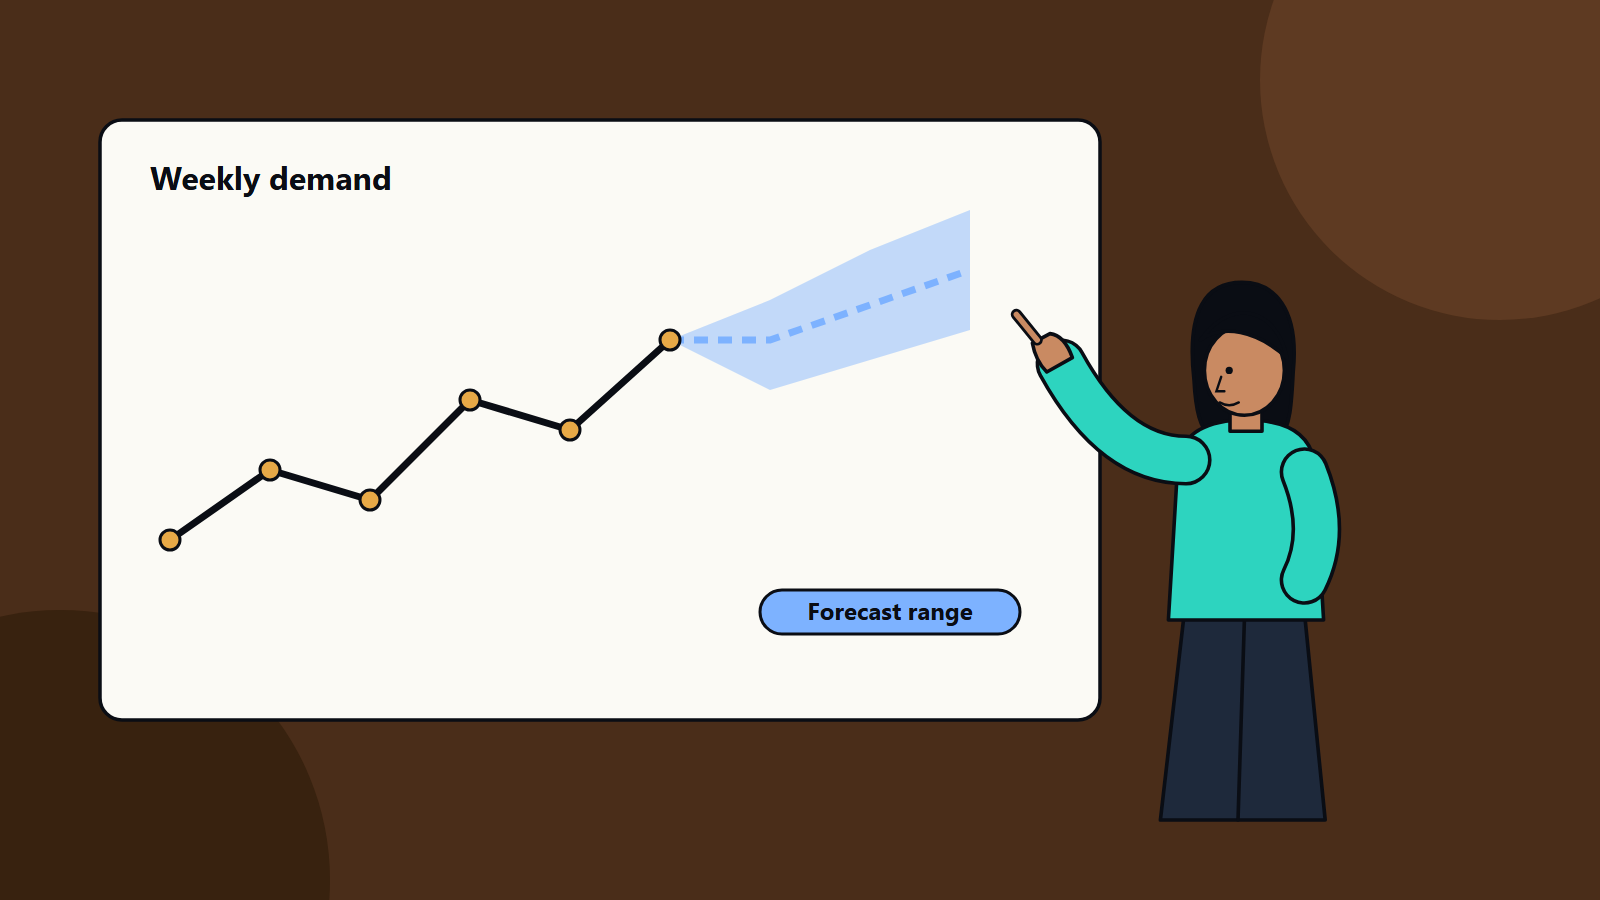
- Use ranges. Prediction intervals show uncertainty, which supports safety stock and capacity buffers.
- Link to inventory policy: reorder points, order quantities and lead times.
- Scenario plan: promotion on or off, supply delay, price change.
- Feed other planning: workforce, production, logistics and finance.
- Close the loop: compare forecast to actual each cycle, learn from large misses and refresh models.
Operationalise
- Automate data pulls, forecasting runs and delivery of results.
- Store forecasts and the model version used, so accuracy can be tracked over time.
- Monitor for data problems, such as late feeds and sudden changes in volume.
- Retrain on a schedule or when performance degrades.
- Make results easy to see in dashboards and planning tools.
- Our article on MLOps basics explains how to take a model from experiment to dependable service.
Common mistakes
- Skipping the baseline.
- Ignoring stock-outs, so the model learns to under-forecast.
- Validating on random splits instead of future periods.
- Adding drivers you will not know at forecast time.
- Over-engineering when a simple model performs as well.
- Reporting one number with no sense of uncertainty.
- Treating the forecast as a target for the sales team.
A first project plan
- Choose one product group and a clear decision.
- Gather two to three years of history and flag events.
- Build baseline and two or three candidate models.
- Validate on the latest periods and compare.
- Pilot with planners for a quarter, track accuracy and bias.
- Expand to more products once value is shown.
How SoftSapien supports forecasting projects
SoftSapien builds forecasting solutions for retail, manufacturing, logistics and services, from data preparation to models, dashboards and integration with planning systems. Learn about our data science and data analytics services.
To explore your own forecasting needs, use the contact page to chat with us, send a message or schedule a free consultation call.
Frequently asked questions
What data do I need for demand forecasting?
Clean history of sales or demand with dates, products and locations, plus flags for stock-outs, promotions, price changes and holidays, and drivers you will know in advance.
Which method should I use?
Start with a baseline such as seasonal naive or exponential smoothing. Use machine learning when many drivers and many related series justify it, and compare against the baseline.
How do I validate a forecast?
Hold out the most recent periods, use rolling origin tests, compare with the baseline and track both error and bias by segment.
How should forecasts be used in planning?
Use prediction ranges for safety stock and capacity buffers, link to reorder policies and compare forecast with actual every cycle.
Can SoftSapien build forecasting solutions?
Yes, from data to dashboards and planning integration. Contact SoftSapien through the contact page to chat with our team, send a message or schedule a free consultation call.