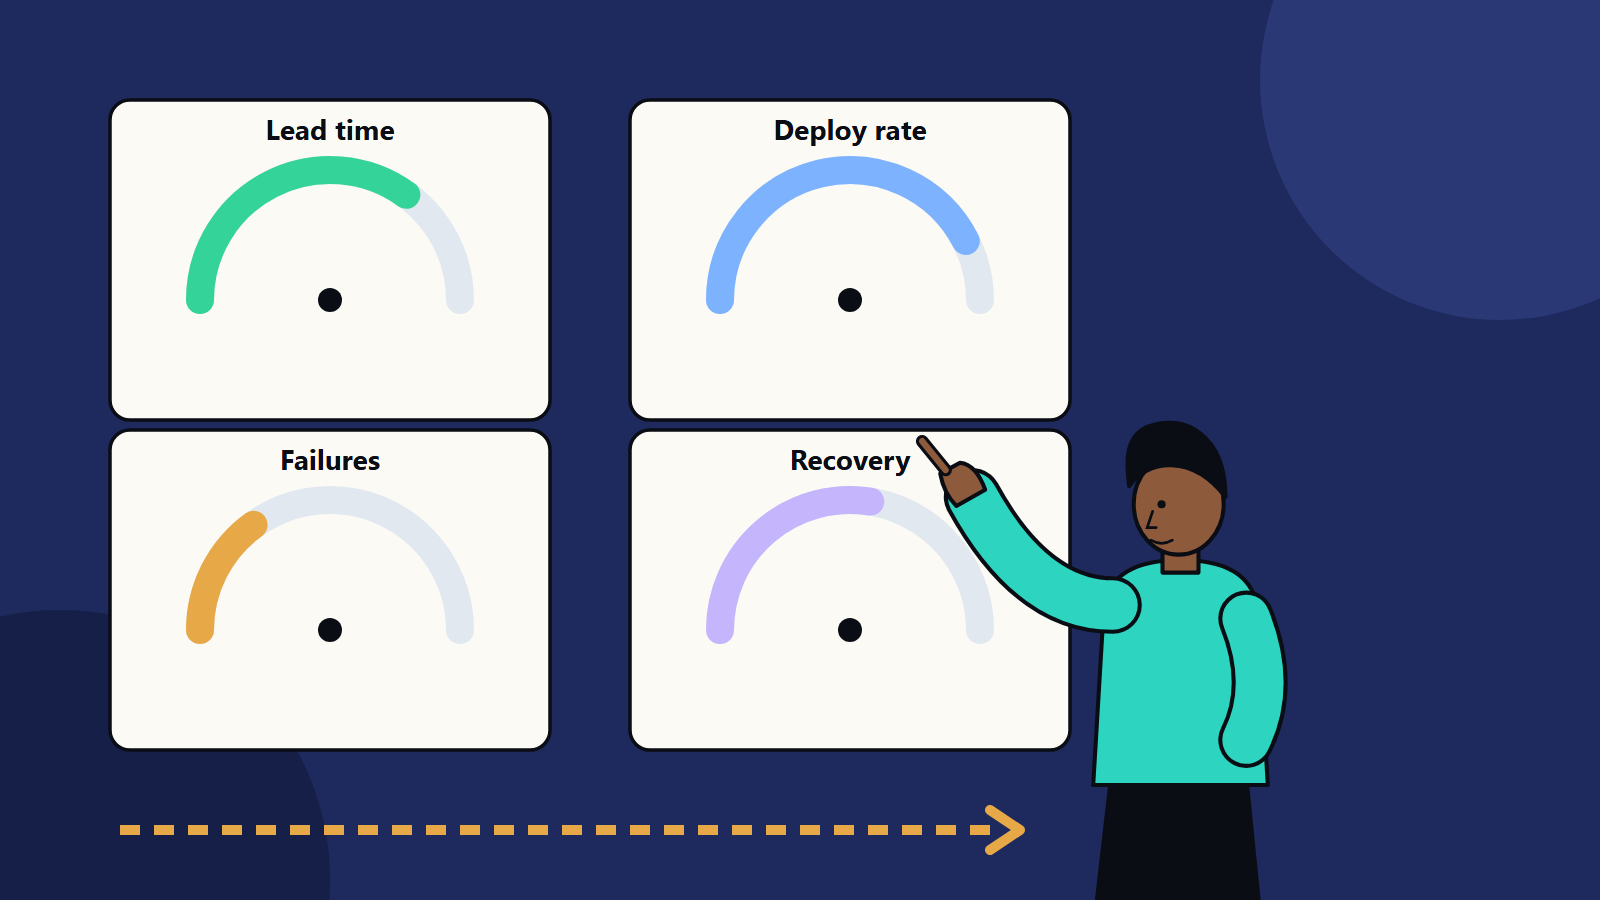
Short on time? DORA’s research points to a small set of delivery measures: how often you deploy, how long a change takes to reach production, how often releases cause problems and how quickly you recover. Track them for each team over time, use them to find bottlenecks and treat them as signals for improvement, never as individual targets.
Software teams are often asked to move faster and break less. Without measurement, both claims are guesses. The DevOps Research and Assessment programme, known as DORA, has studied thousands of teams and identified a compact set of measures that describe software delivery performance. Those measures give engineering leaders and business owners a shared language.
This guide explains what each DORA measure means, how to collect it and how to use it. It applies to a three-person product team and to an engineering organisation with hundreds of services.
Key takeaways
- DORA’s guidance describes throughput measures (change lead time, deployment frequency, failed deployment recovery time) and instability measures (change fail rate, deployment rework rate).
- Speed and stability tend to improve together when teams work in small batches with strong automation.
- Measure at team or service level, and trend the numbers. Do not rank people.
- Metrics point to where to look. Fixing causes takes changes in process, tooling and culture.
- Start with simple, honest data from your pipeline, then refine.
The measures
The DORA metrics guide lists the following.
Change lead time. How long it takes a change to go from being committed to version control to running in production. Short lead times mean feedback and value arrive sooner.
Deployment frequency. How often you deploy to production over a set period. Frequent, small deployments are easier to test and to undo.
Failed deployment recovery time. How long it takes to restore service after a deployment fails and needs urgent action. Fast recovery limits the cost of mistakes.
Change fail rate. The share of deployments that need urgent intervention afterwards, such as a rollback or a hotfix.
Deployment rework rate. The share of deployments that are unplanned and triggered by a production incident.
Earlier versions of the research described four measures, and you will still see that framing in older material. The current guide adds rework rate. The principle is the same: pair measures of speed with measures of stability.
Why these measures matter
Teams that can release small changes often tend to find defects earlier, learn from users faster and recover quickly when something fails. Long gaps between releases make each release larger and riskier, which leads to more caution and even longer gaps. The measures make that cycle visible.
For business leaders they answer practical questions. How quickly can a customer request reach production? How much of our delivery effort goes into fixing yesterday’s release? Where does work wait?
How to collect the data
Pull data from the systems you already use:
- Version control for commit times and merges.
- CI/CD pipeline for build, test and deployment events and their outcomes.
- Incident and ticketing tools for failed releases, rollbacks and recovery times.
- Monitoring for service health and detection times.
Agree definitions before you count. What is a deployment: a release to all users or to a canary group? Which incidents count as caused by a change? Write the rules down and apply them consistently, because small changes in definition distort trends.
Start with a spreadsheet if you have to. Automated dashboards come later, once the definitions are stable.
Reading the numbers
- Long lead time: look for waiting. Common causes include slow code review, manual testing, approval queues, infrequent release windows and large batches.
- Low deployment frequency: look for fear. Teams batch changes when releases are painful, so improve automation and testing and shrink changes.
- High change fail rate: check test coverage, environment differences, review quality and change size.
- Slow recovery: look at detection, rollback options, runbooks, on-call practice and observability.
- High rework rate: study incidents for patterns, such as configuration errors or missing checks.
Practices that improve the measures
- Small batches. Break work into small, independently releasable changes.
- Trunk-based development with short-lived branches and frequent merges.
- Automated testing at unit, integration and end-to-end levels, kept fast and reliable.
- Continuous integration and delivery pipelines that build, test and deploy the same way every time.
- Feature flags that separate deployment from release and allow quick switch-off.
- Infrastructure as code for repeatable environments.
- Observability with logs, metrics and traces to find problems quickly.
- Blameless reviews after incidents, focused on system improvements.
- Loosely coupled architecture so teams can release without waiting for others.
Pitfalls
- Using metrics as targets. When a measure becomes a goal for individuals, people find ways to improve the number without improving delivery.
- Comparing teams unfairly. A team maintaining a regulated payment system and a team running a marketing site face different constraints.
- Counting activity. More deployments of trivial changes may inflate frequency without adding value.
- Ignoring context. Pair the numbers with team conversations and customer outcomes.
- Neglecting wellbeing. Sustainable pace, on-call load and satisfaction affect results over time.
A first-quarter plan
- Weeks 1 to 2: choose one or two teams and agree definitions.
- Weeks 3 to 4: collect a baseline from existing tools.
- Month 2: hold a review with the team to find the largest bottleneck and choose one improvement.
- Month 3: implement the change and compare the numbers.
- Quarterly: repeat and extend to more teams.
Beyond the metrics
Delivery speed matters when it supports value. Add measures of customer outcomes, reliability and cost, such as availability, user satisfaction and cost per release. DORA’s research also looks at team capabilities and culture, which help explain why numbers move.
Working with SoftSapien on delivery performance
SoftSapien helps engineering teams measure and improve delivery, from pipeline setup and test automation to platform and operations support. Our DevOps services cover assessment, tooling and coaching, and our QA and testing specialists help build reliable automated checks.
To talk about your own delivery pipeline, use the contact page to chat with our team, send a message or schedule a free consultation call.
Frequently asked questions
What are DORA metrics?
They are software delivery measures from the DevOps Research and Assessment programme: change lead time, deployment frequency, failed deployment recovery time, change fail rate and deployment rework rate.
Do speed and stability conflict?
Research suggests they tend to improve together when teams work in small batches with strong automation and testing.
Should we set DORA targets for individuals?
No. Measure at team or service level, trend the numbers and use them to find bottlenecks. Individual targets invite gaming.
How do I collect the data?
Use version control, CI/CD pipeline, incident and monitoring tools. Agree definitions first and apply them consistently.
Can SoftSapien help improve delivery performance?
Yes, with pipeline, testing and platform support. Contact SoftSapien through the contact page to chat with our team, send a message or schedule a free consultation call.